Ranking questions
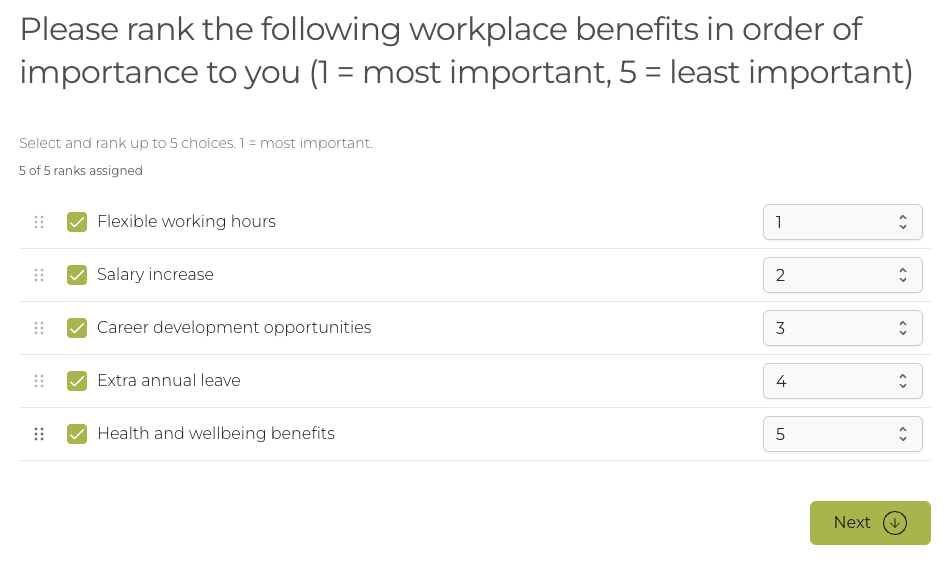
Ask people to put a list of options into order rather than scoring each one separately. Results are reported ranked overall and split by demographic group, with an overall score for each option, and small groups held back under your reporting threshold.
Sharing results with your leaders
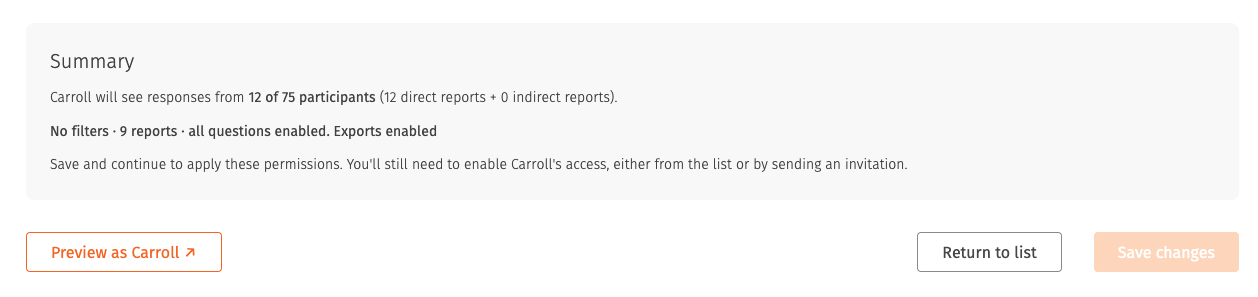
A guided setup for deciding who sees which results, showing how many people each choice covers before you confirm it. Grant, remove or invite report viewers in bulk while you carry on with other work, search leaders by name or email, and see how many have signed in since being given access.
Passcodes by demographic group
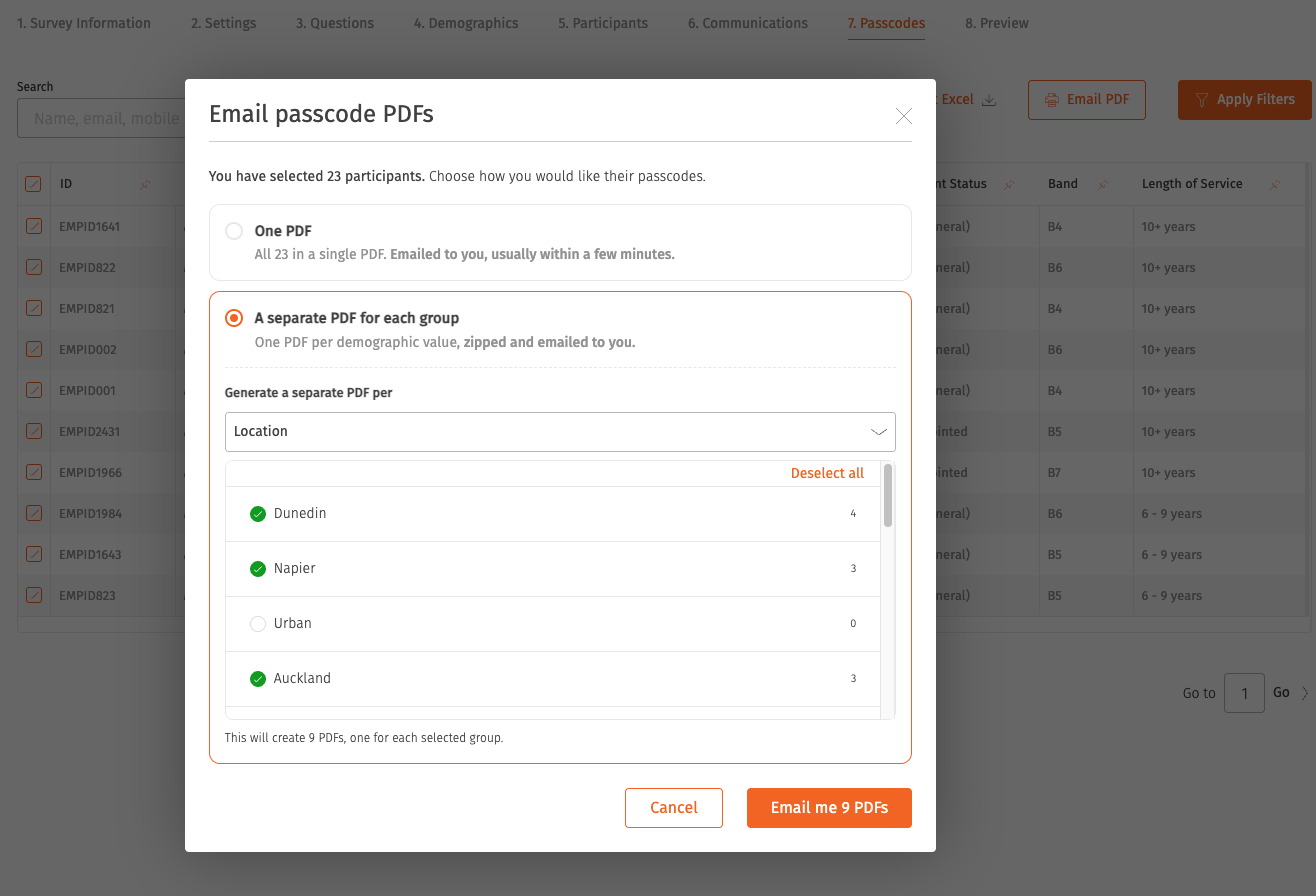
Export passcodes as one file per demographic group, delivered together as a single zip, instead of filtering and exporting one group at a time.
Set your own survey completion estimate
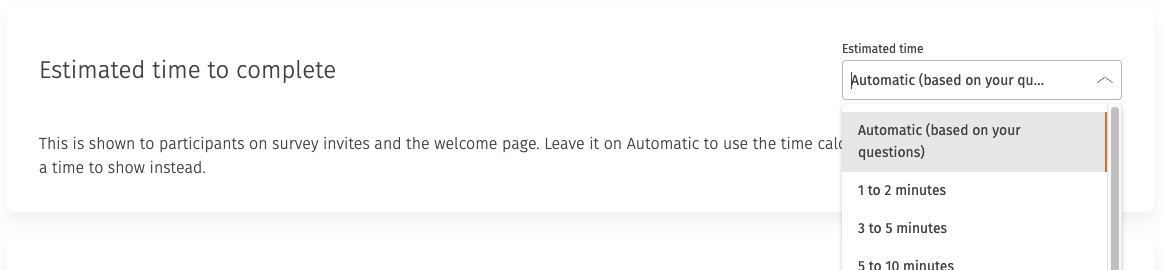
Set your own estimate of how long a survey takes, in place of the calculated one. Participants see your figure on the invitation and the welcome page, so the expectation you set is the one they get.
Invitation sending controls
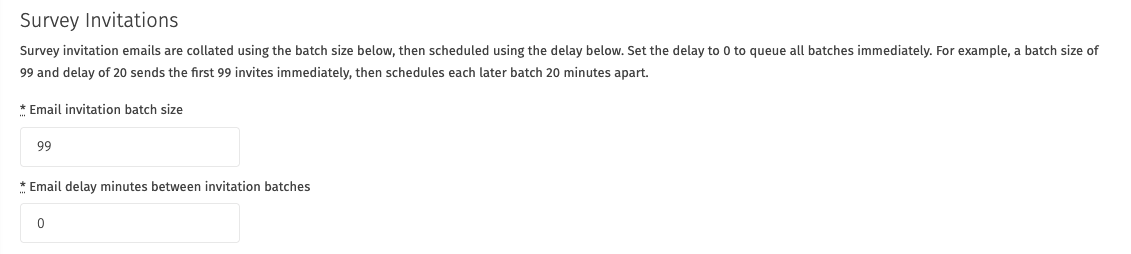
Set how many invitations send in each batch and how long to wait between batches, to suit your organisation's mail systems. Invitations waiting on the next batch show as pending.
Choosing what each leader can do
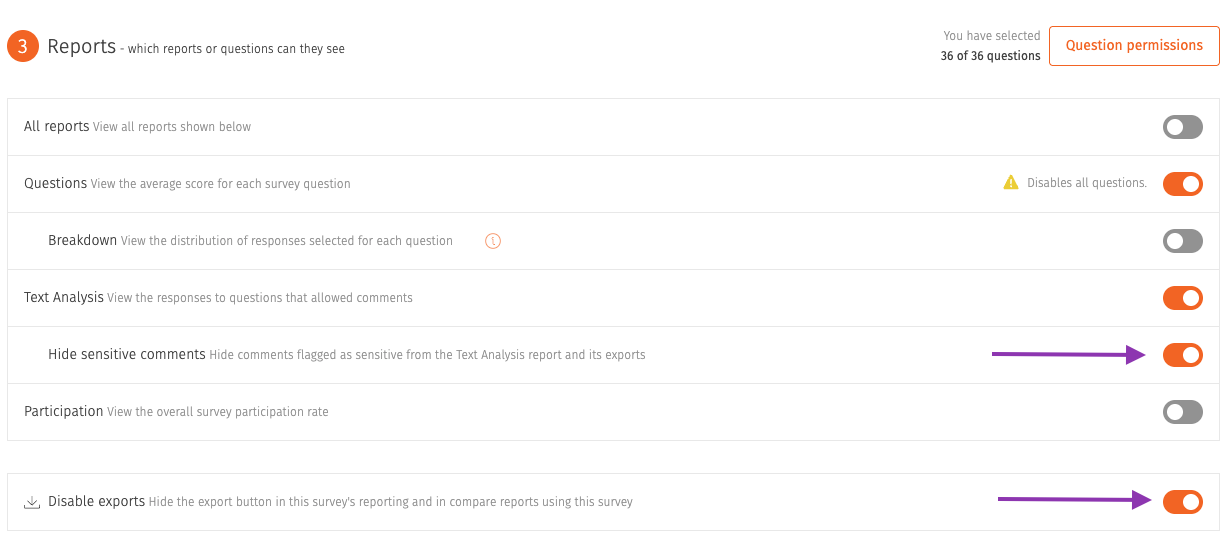
Decide what a report viewer can do as well as what they can see. Allow someone to read their results without exporting them, or share the Text Analysis report with comments flagged as sensitive held back. A prompt appears before you invite anyone whose group has not yet reached your reporting threshold.
Write your own survey extension emails
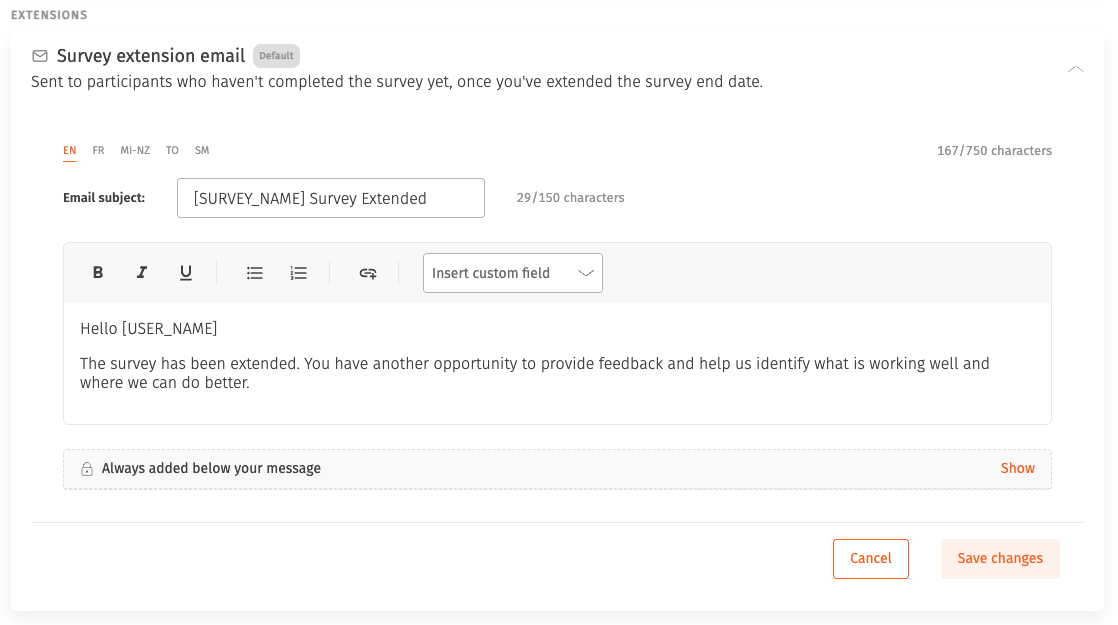
When you extend a survey's closing date, the emails that go out can be written in your own words rather than sending our default wording. Extending a survey is usually a nudge about low response rates, and that message lands better in your organisation's voice than in ours.
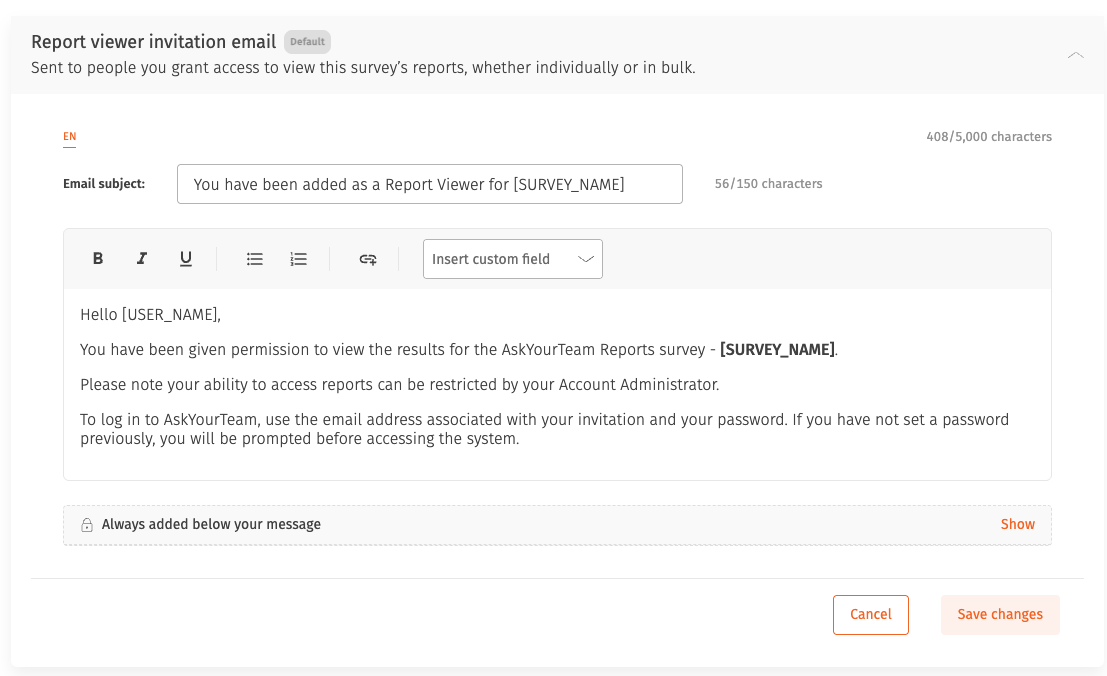
Write your own report viewer invite emails
The email that tells a leader their report is ready, and gives them the link to it, can be written in your own words. For many leaders this is the first thing they see of the whole survey, so it is worth sounding like you, and worth saying what you want them to do with the results. You can also link to your own training material, so a leader opening their results for the first time knows where to go for help reading them and acting on them.
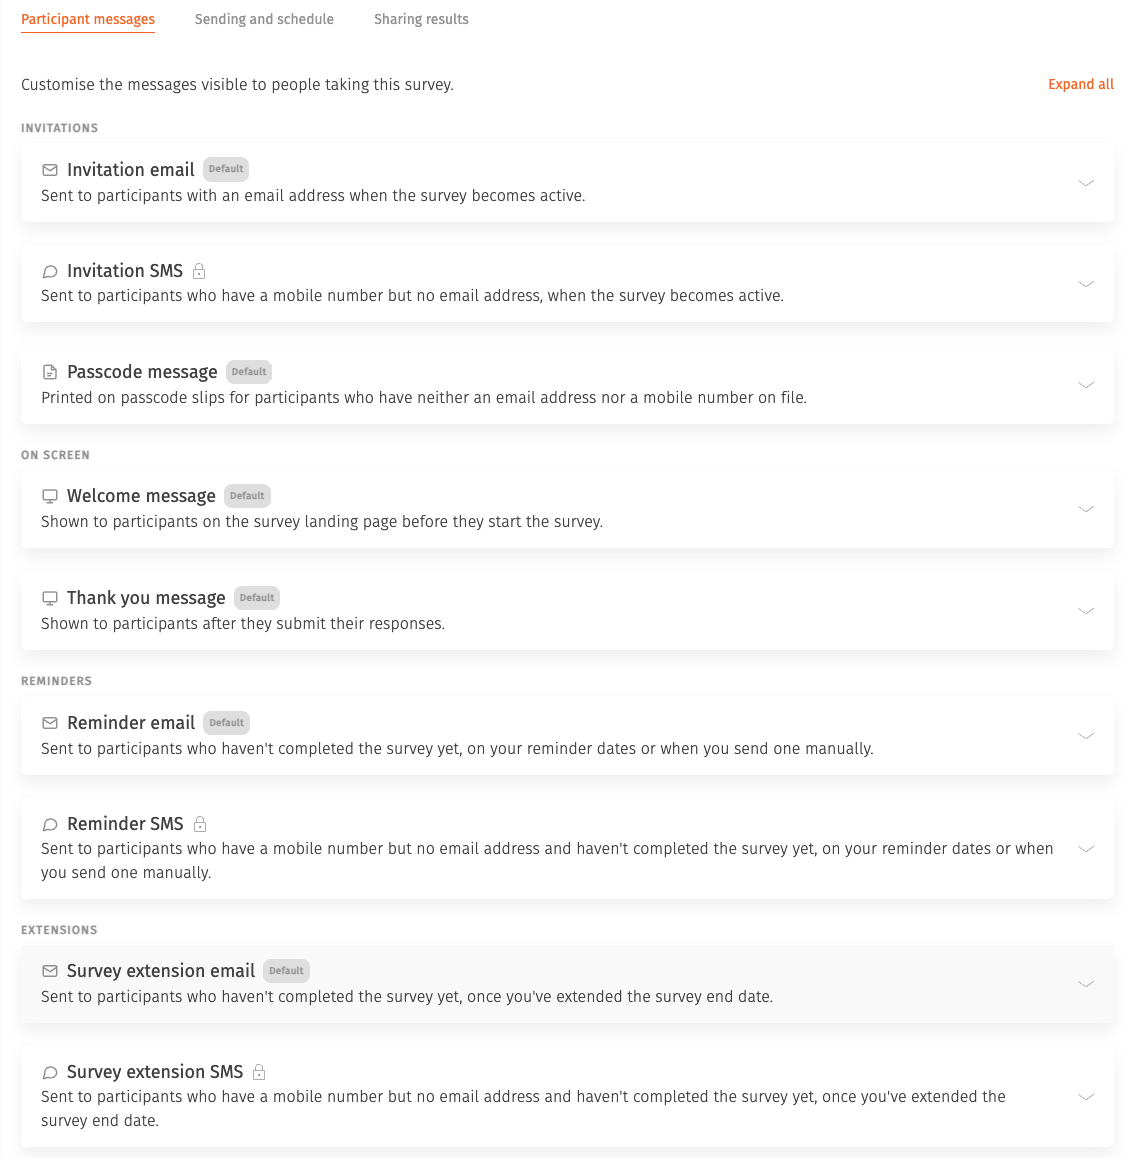
Redesigned publish experience
The screens you use to get a survey out have been rebuilt around the work you actually do on them. Communications is grouped by who you are talking to, with participants, report viewers, and sending and schedule each in their own place, and cards stay closed until you need them. Overview and Publish are cleaner, and the page after publishing suggests next steps based on the channels your survey really uses, whether that is email, SMS or passcodes.
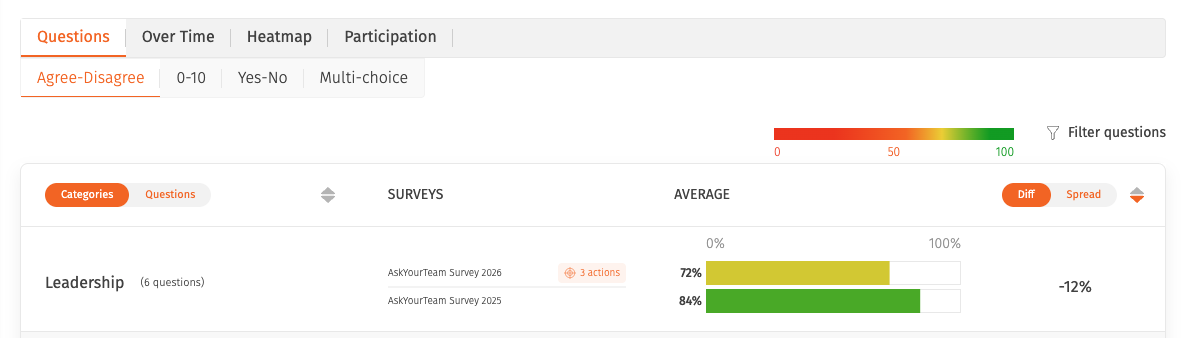
Comparing surveys
Comparisons cover every quantitative question type, so far more of each survey carries through rather than dropping out. Set a demographic filter once and apply it across every survey in the comparison, with a summary of where it matched.
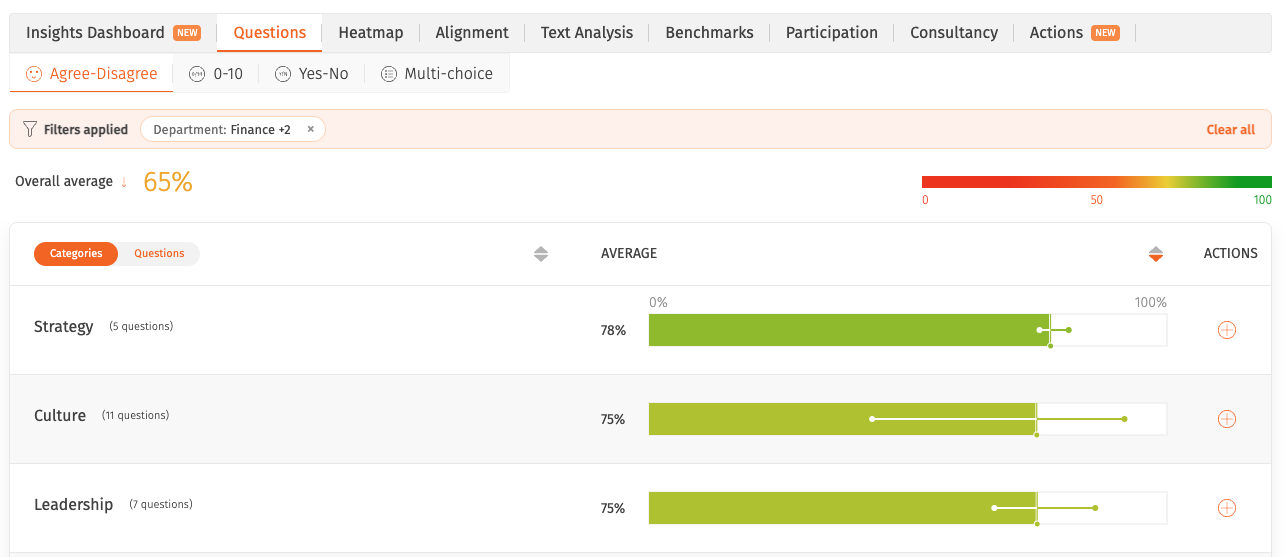
See and change your filters
Reports show exactly what is filtered, written out in full, with each filter as a pill you can select to change. The same filter and summary bar appear across the participant library, actions, survey participants, passcodes and report viewer permissions.
Confidential surveys
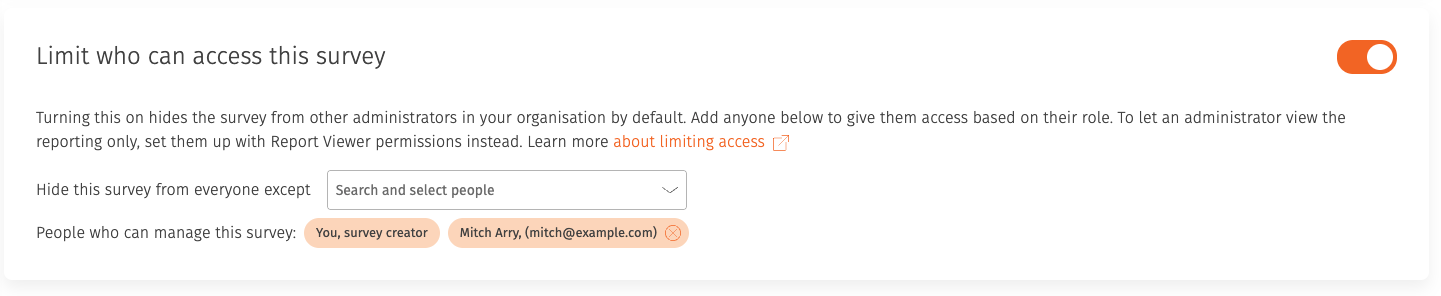
Name the administrators who keep access to a confidential survey, and change a survey's confidentiality at any point in its life rather than only while it is in draft.
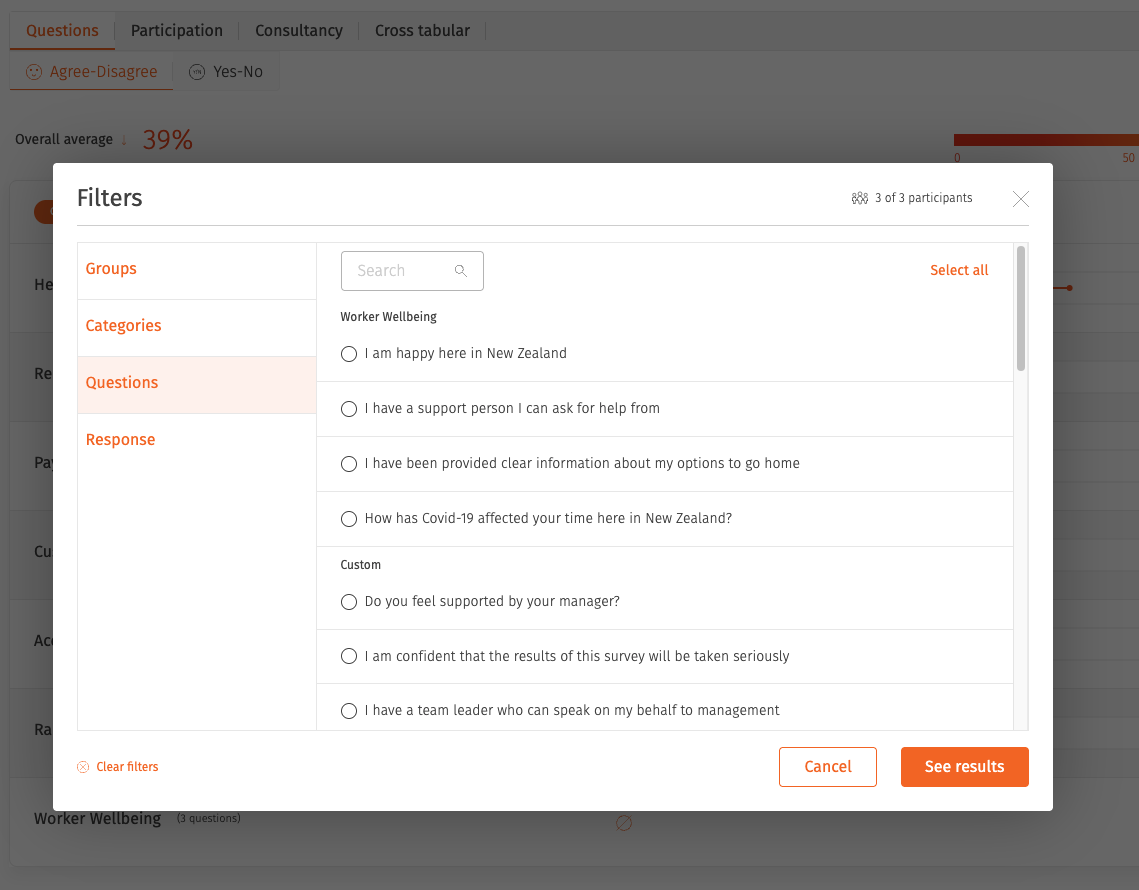
Filter by how people answered
Filter a report by how people answered a particular question, then read the whole report through that group. Every chart, table, heatmap and export follows the same cohort. Available on surveys that are not anonymous.
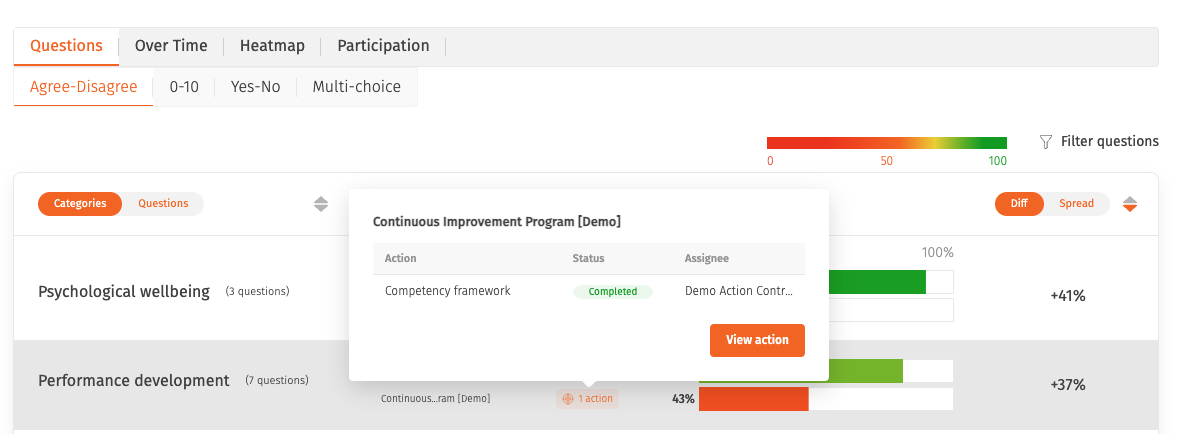
Seeing whether your actions worked
The actions you committed to after one survey now sit alongside that survey's results in a comparison, next to the results that came after them. You can see what you said you would do, what you did, and what changed, in one view instead of three. It closes the loop between asking your people, listening to them, acting on it and measuring whether it worked.
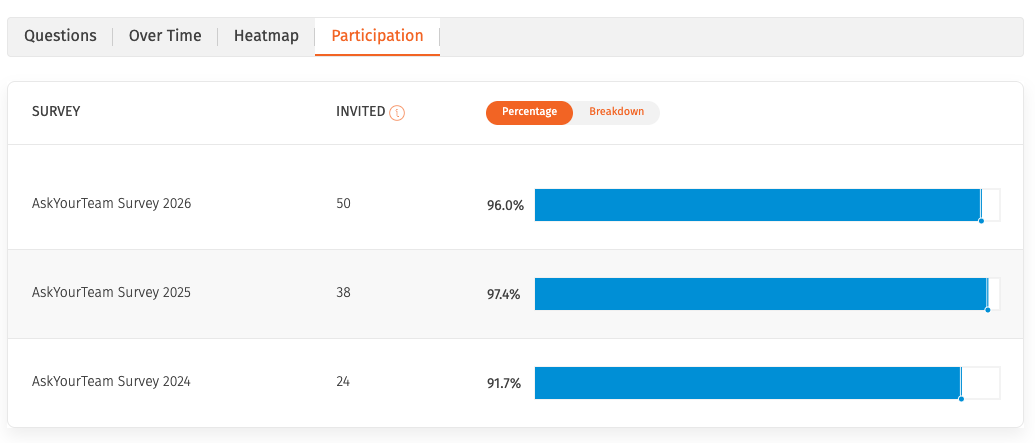
Participation comparison
A comparison report showing response rates across multiple surveys side by side, so you can see participation moving over time or across parts of the organisation.
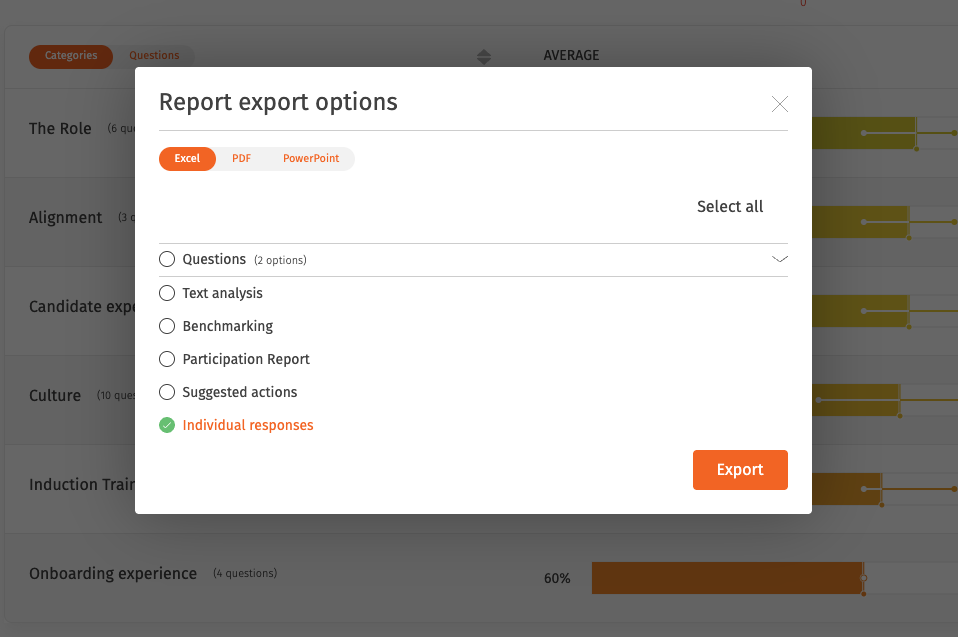
Individual responses export
An export with one row per respondent and a column per question, covering every question type including written comments and free text. Available on surveys that are not anonymous.
NPS questions
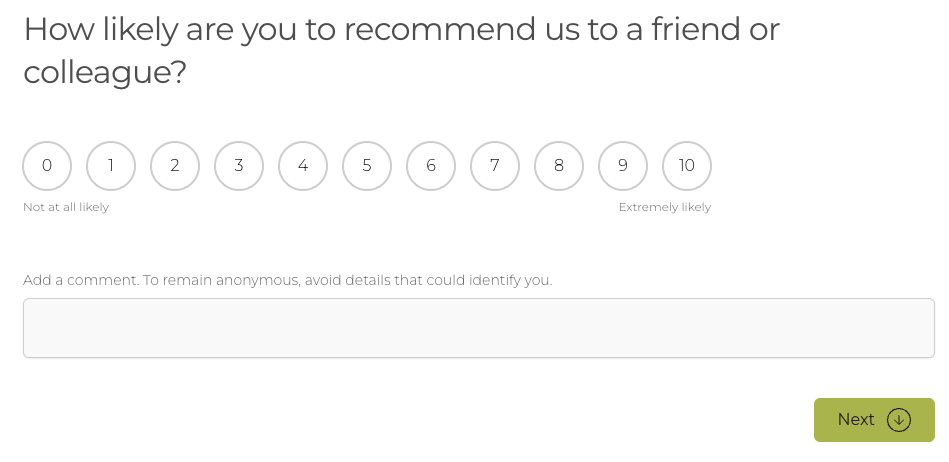
Net Promoter Score is a standard question type, available when building any survey and supported across standard reports, comparison reports and every export.
Skip logic on multi-choice questions
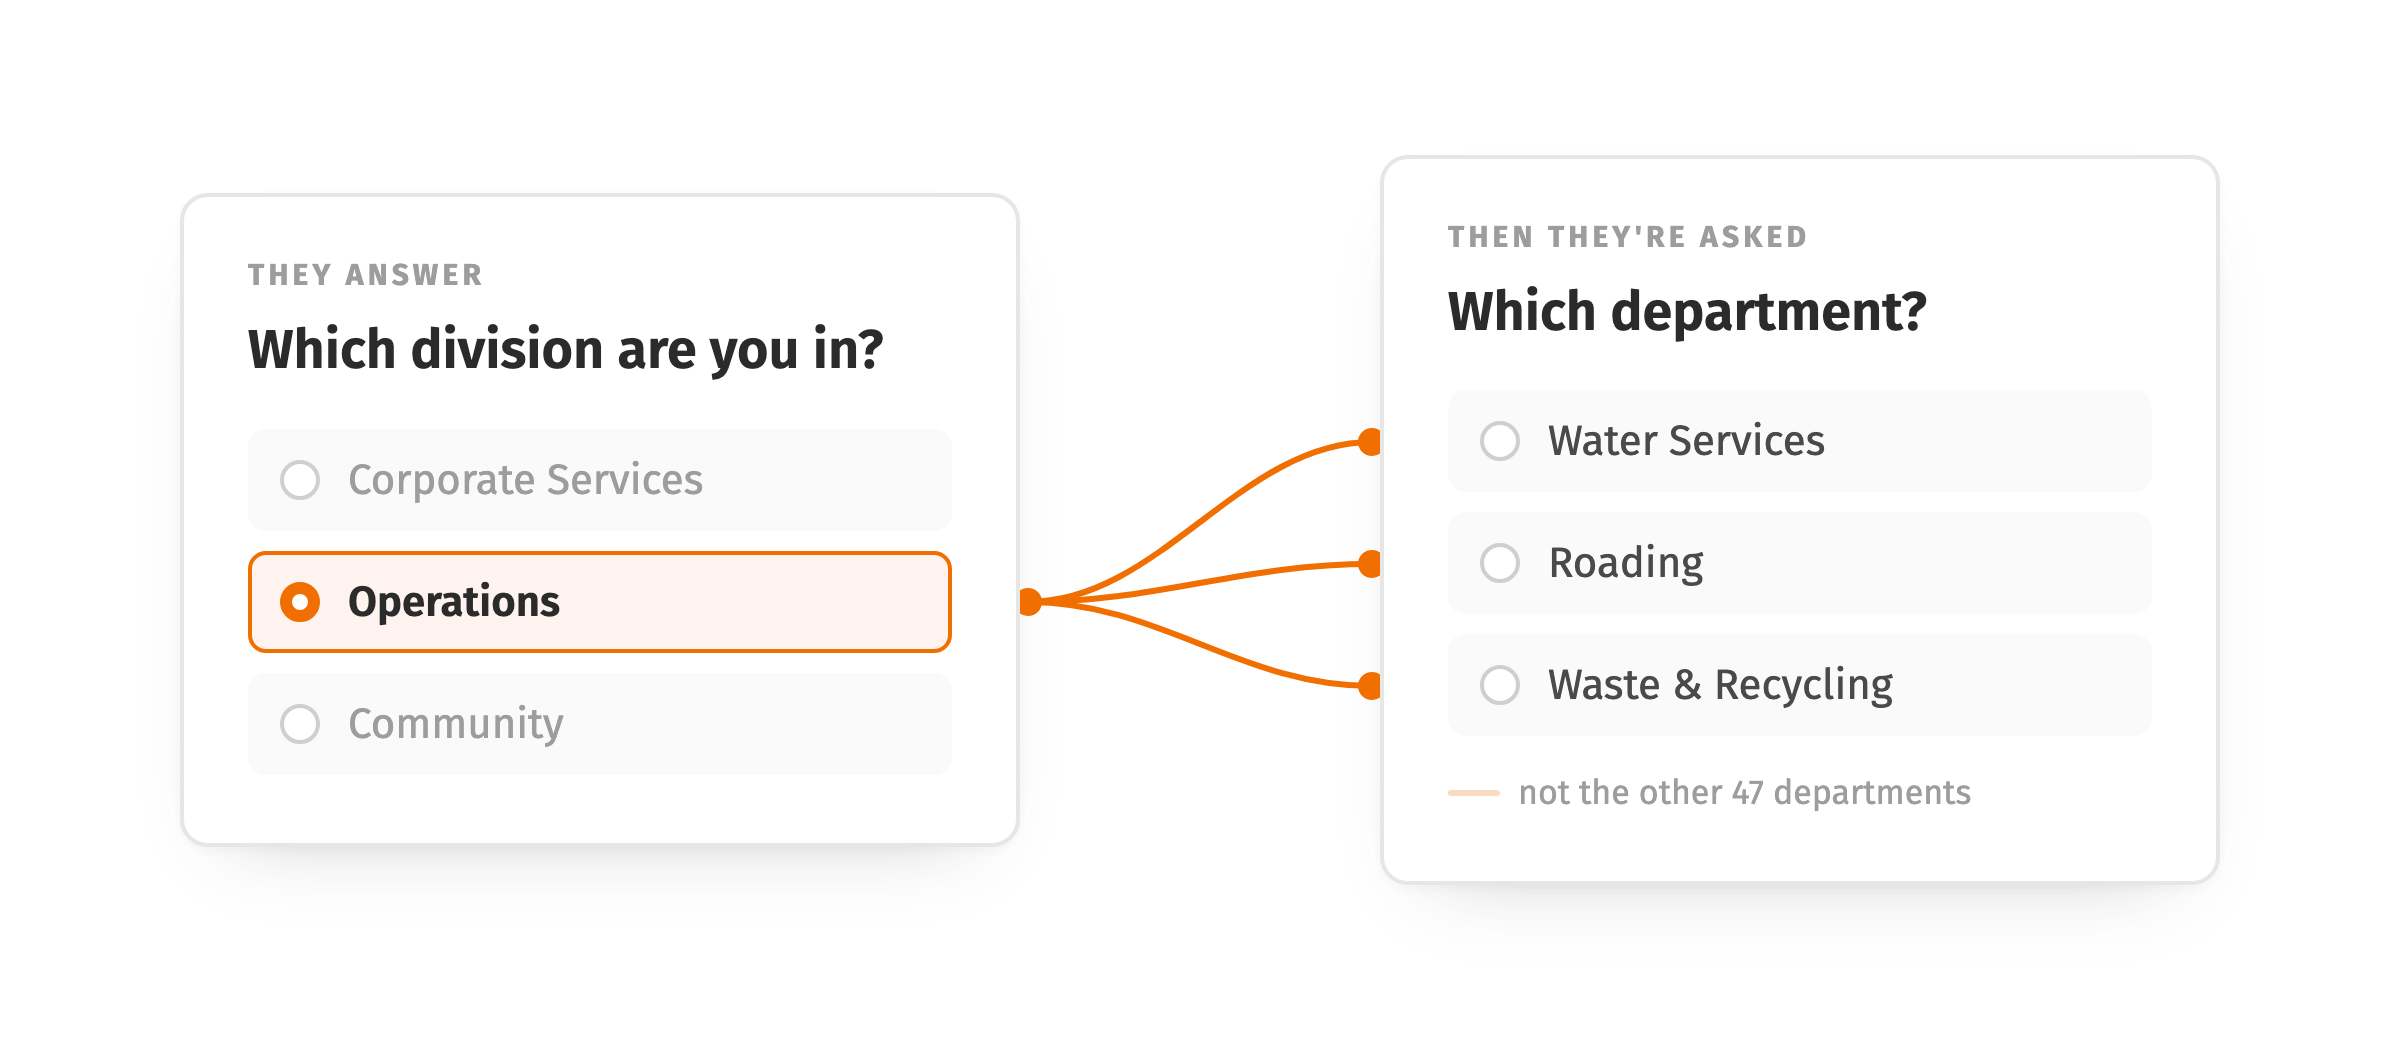
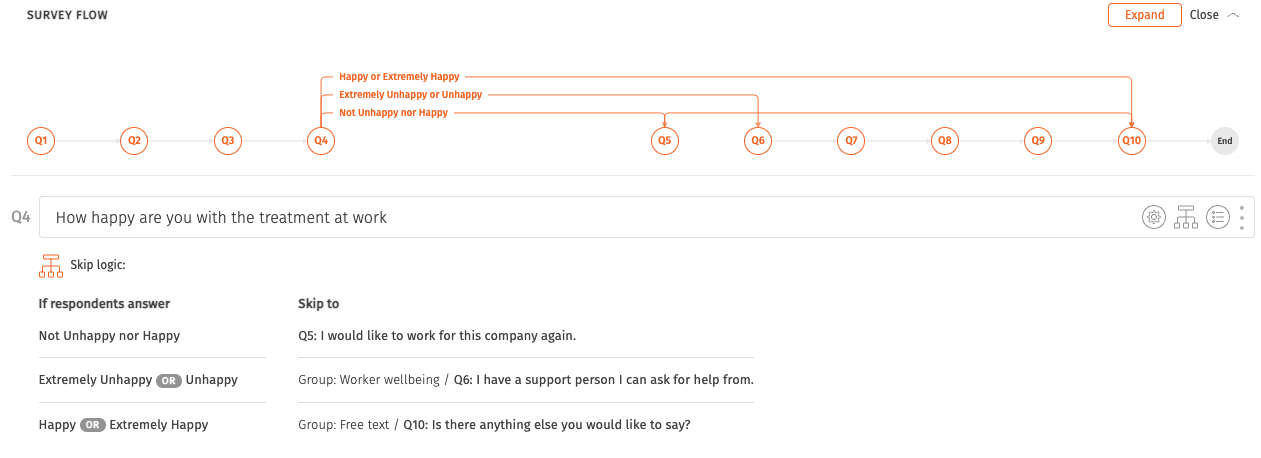
Build skip logic from multi-choice questions as well as yes or no questions. Each question has its own rules table, long chains collapse for readability, and a map of the survey flow stays at the top of the questions tab.
Compulsory comments
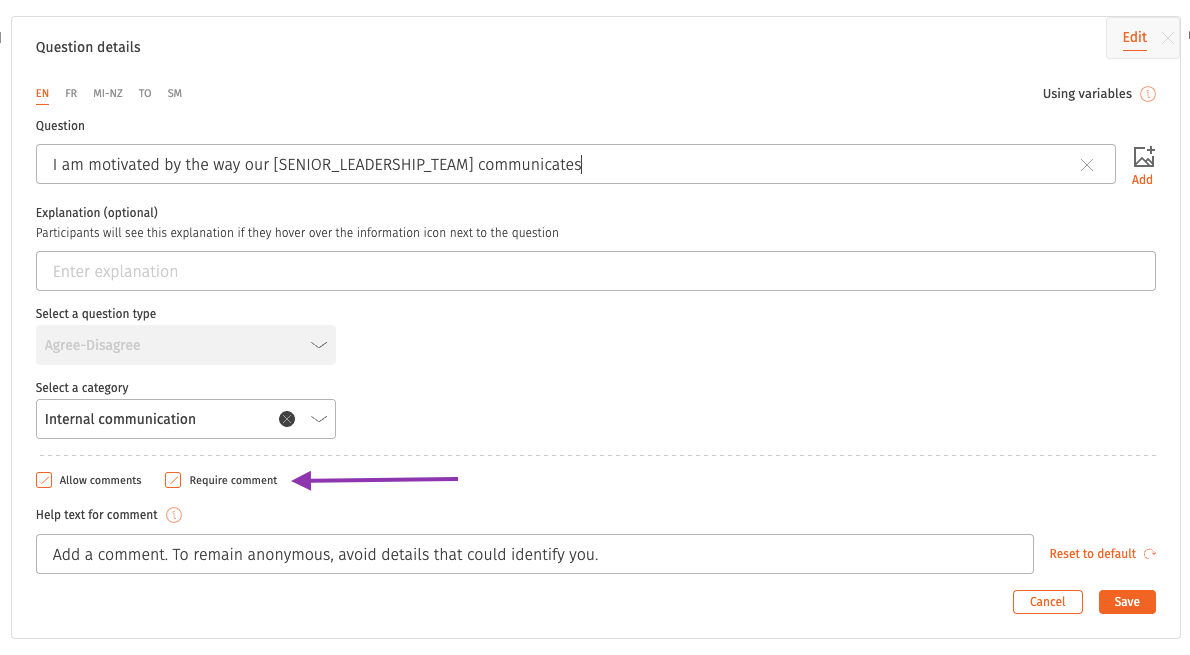
Make a written answer compulsory on any question, for the moments where a score on its own does not tell you enough.
Spotting missed onboarding and offboarding surveys
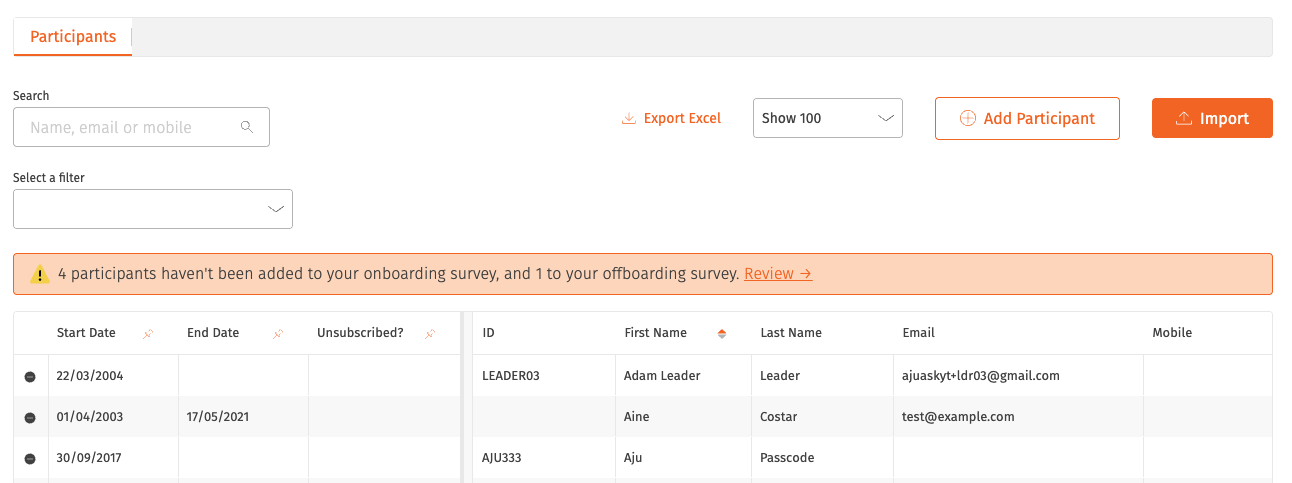
The participants library flags people who joined or left in the last 12 months without receiving an onboarding or offboarding invitation, so each one can be added or deliberately skipped.
Action checklists
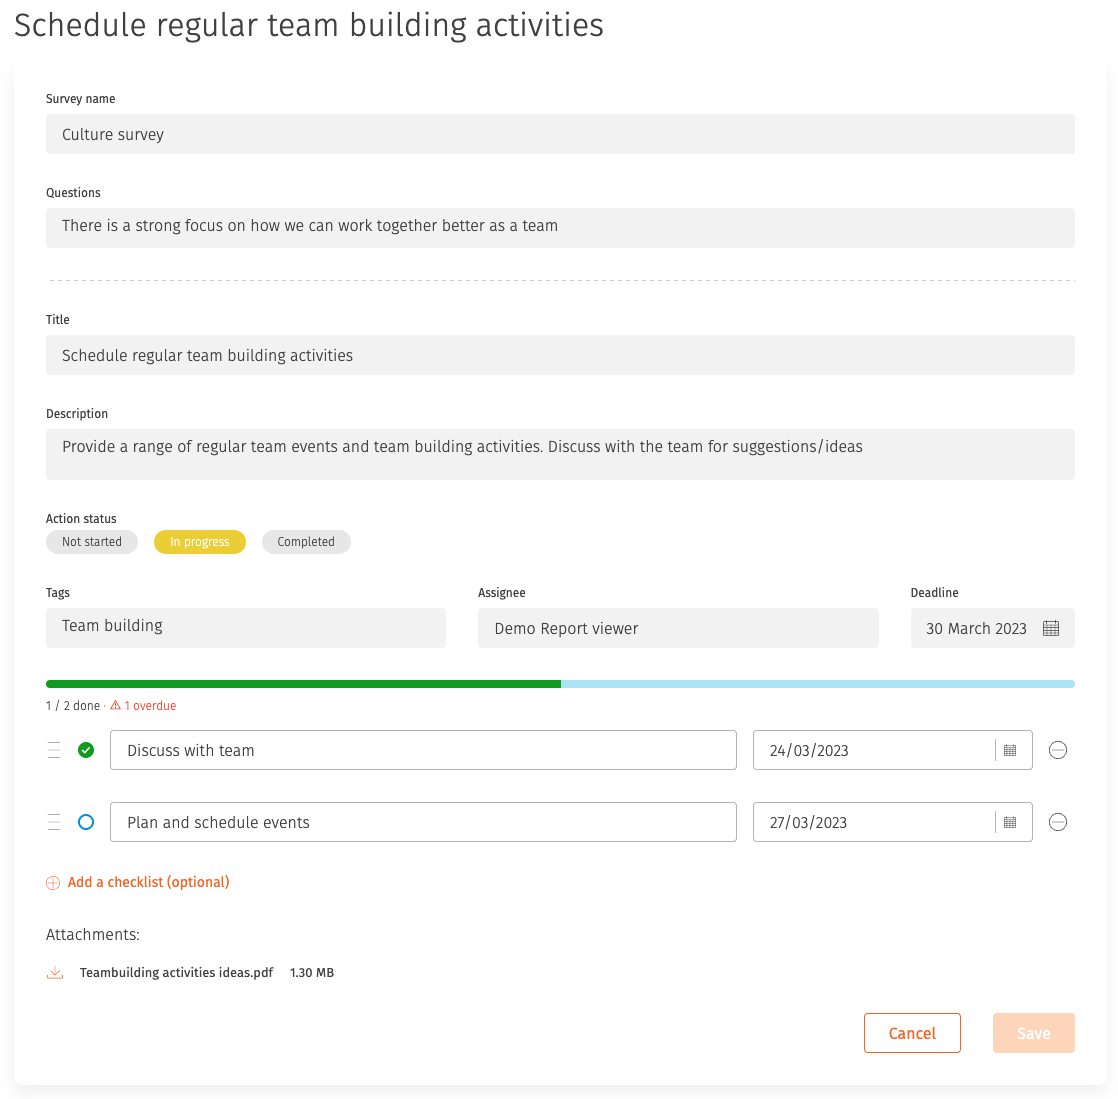
An action can hold a checklist of smaller tasks, each with its own status and order, with a progress bar as items are completed. Items can be marked as needing a deadline.
Media in welcome and thank you pages
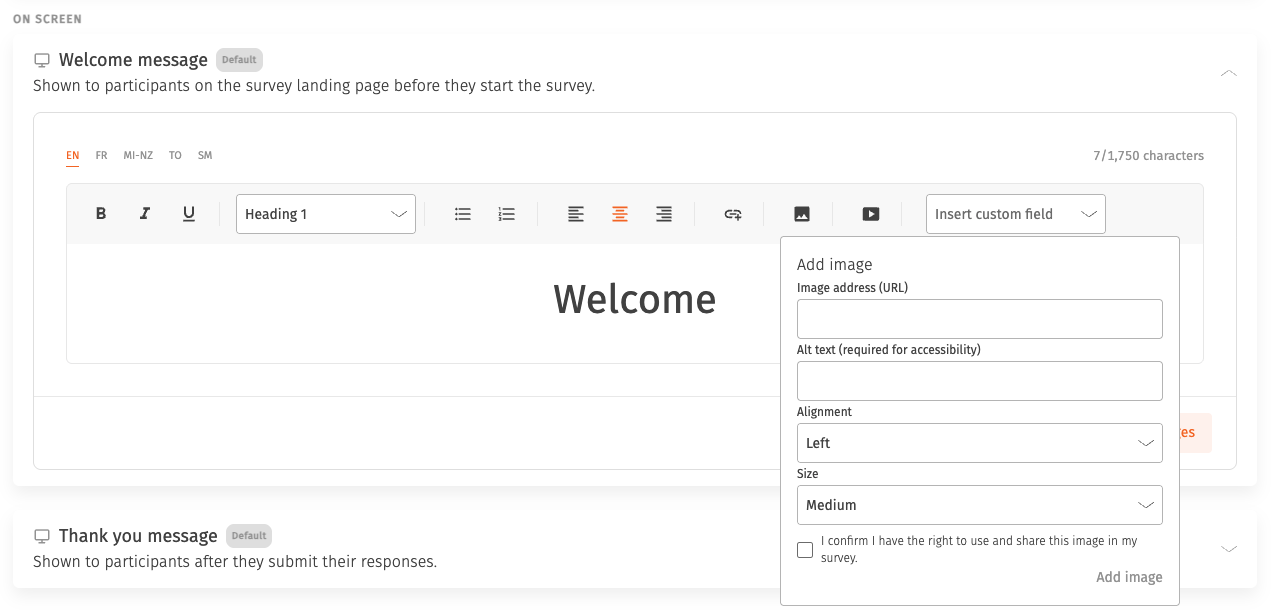
Add images and YouTube videos to welcome and thank you pages using the editor. Media sizes itself for phones and desktops.
Linked demographics
Link demographic categories so the options in one depend on the answer to another. Selecting a department can narrow the team list to that department's teams only, giving participants a shorter list and giving you cleaner data in return.